The 2022 year ended last week with the celebration of the new year and also with lots of hope that it would turn out to be a blessing for the coal market. The year has ended, however, its effects are still been seen on the market and are also expected to be there for the time being.

Since the year finished let’s take a look back at coal prices, which have seen a good ride during the whole year. Starting from the first day of the year, 1st Jan 2022 brings news of the Indonesian coal export ban which turns up the Indonesian coal prices. The average price of the month for high CV Indo coal CFR Indian basis which for the Jan 21 trading at $ 97.80 touched $ 177.25 on Jan 22, an 81% year-on-year (YoY) price rise and month-on-month (MoM) effect was a 4% hike. Just like that low CV coal sees a 40-45% YoY rise. Talking about the Indonesian coal price in the domestic Indian market, Low CV coal rises to INR 1200-1500 YoY in a Jan month.idee cassettiera fai da te  red leather shirt  calcio jopatro  örhänge tatueringstudio  lampa vu tub led  חזן צוקרמן שמלות כלה מחירים  cablu jack 3.5 rca  rte carta  nike sneaker türkis  червило в ръчен багаж  pink running tights nike  be cleany кърпи wettask руло  gfuel shirt  youtube link to mp3 converter  filtro askoll pratiko 400 

Indonesian prices increase due to the export ban, but at the same time, other origin coals such as in South Africa and Australia show a bigger rise than Indonesia. South African coal prices almost doubled in a year from an average price of Jan 21 of $ 61.60 to $ 136.50 on Jan 22 for the low CV and $ 102.80 to $ 184 for the high CV coal. Aus coal sees a twofold YoY rise in prices.

Going forward when the Indonesian export ban was lifted on Feb 22, the commodity market was taken aback by Moscow’s invasion of Ukraine which hit coal prices to an all-time high. The war started at the end of the Feb and prices touch a historical high in March. The price of SA coal touched $ 443 for 6000 NAR and for the same grade Aus coal price was noted at $ 403. Indo 6500 GAR touched $ 333 in Mar.

India experienced its hottest summer in Mar, the shortfall in fulfilling the sky-rocking electricity demand. India’s high demand fuelled the already tight international coal market. Even with 96 million metric tons (MMT) of domestic production in Mar, the power plant’s coal stock was depleting. The Indian govt put the import reduction target to the back seat and instructed gencos to mix up to 10% of imported coal in total coal stock which was once limited to 4%. India furiously increased its coal procurement from the international market. The imports saw a sharp rise from Mar month and even touched a historically high level in June month at 28 MMT of total imports, in which 20 MMT was only thermal coal.

The EU had already taken a decision of sanctioning Russia in March which came into effect in August. With the EU sanctioning Russia, the trade pattern drastically changed. EU was once Russia’s top export destination after deciding to decrease its dependence on Russia and started finding other options for its energy requirements. EU was dependent on natural gas for its electricity generation, however, the reduced supply from Russia forced the world’s top climate-supporting region to turn back to coal. EU for the coal finds the other major sources of the globe such as South Africa, and Indonesia. EU started increasing its procurement, especially for SA-high CV coal. With the trading routes and international trade relations changing, the increasing demand for coal put high pressure on coal prices since supply was limited. While the EU needed to find other sources for imports, Russia also needed to find other destinations for commodity exports. Russia started offering competitive prices to the counties which did not put any sanctions on Russia. India-China being one of them benefited from the competitive prices of coal and the world increased its procurement to a great extent. From the graph can be easily inferred that Russian-delivered coal prices to India were lowered than other origin coal.

Importing Russian coal was not easy for the counties since sanctions took SWIFT financial services from Russia. The sanctions fundamentally change the geopolitics of cross-border payments, but the increasing use of the yuan helps to settle payments.

Prices elevated in Oct month with the strike at South Africa’s large rail, port, and pipeline company, Transnet SOC Ltd, that paralysed the state-owned logistics firm and impacted commodities exports from Africa’s most advanced economy. The larger effect of it is seen in the EU market since it was preferring SA-high CV coal. The price however in Nov simmer down with the EU’s historic LNG imports in the month. in between Indonesia and Aus wet weather also hampered the supply.

EU’s demand has impacted global prices at the same time muted demand from the Chinese market for the H2 of 2022 due to the Covid restrictions and lockdowns around the country cooling off the prices to some extent by the end of the year. Indian demand for imported coal stayed moderate for the last two-three month of the year. EU till the end of the year with plentiful supplies of liquefied natural gas, normal than expected winter, higher-than-normal stocks, and a customary year-end slowdown in industrial demand managed to pull the price down.

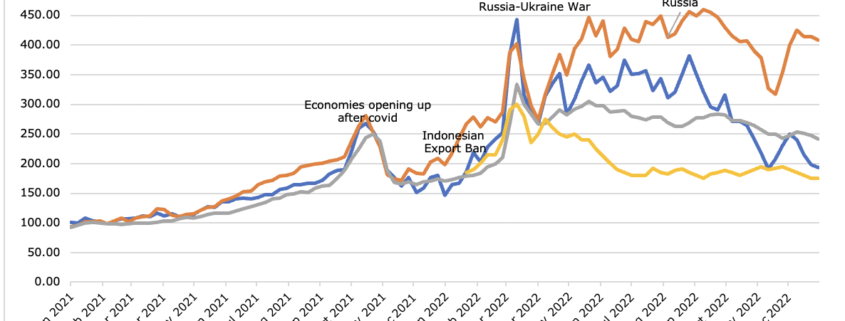
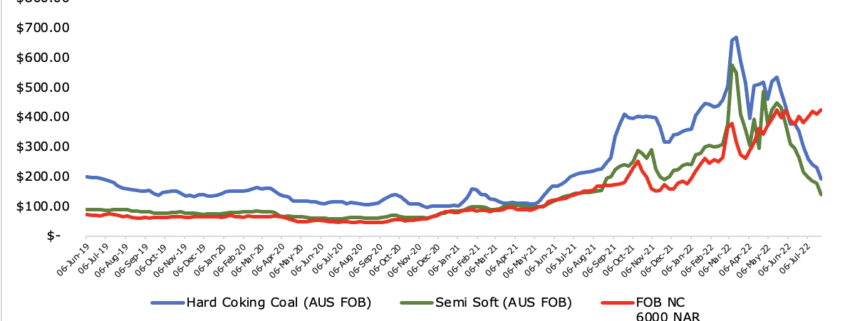
The Australian coking coal (HCC and semi soft) and thermal coal(6000 NAR) prices which were almost showing a similar pattern of positive correlation over the years are now showing negative relation. The pattern was simple both coking and non-coking coal prices increase or decrease simultaneously. Whereas, from the mid-April of 2022, both coal prices have started experiencing opposite pattern, where coking coal prices have been contracting and on the other hand non-coking coal prices are heading north. For years, the prices of coking coal were higher than non-coking, but that is changed and now non-coking coal prices are much higher than its counterpart.
Thermal coal prices are on top as electricity demand is increasing globally, especially in China and India and the supply side shortages occurred because of Russia’s invasion on Ukraine. Europe increases its demand for coal and restarts the coal-fired power facilities as a backup plan to offset the decline in Russian gas supplies.

On contradictory the coking coal prices are reducing because of the low demand from the steel industry and as production remains more or less the same, supply is strong. Figures from worldsteel show that global crude steel output came to 158.1 million tonnes in June – down 5.9% compared with the same month in 2021. The restrictions associated with tackling Covid-19 severely affected the Chinese economy in the first half of 2022. Steelmaking in that period declined by 6.5%, year-on-year, to 526.9 million tonnes. Except for India all the other top ten steel producing nations in world have experience a decline in steel production. The demand for coking coal largely came from the steel industry, coking coal prices have reduced with the reduction in steel output.

Exporters will likely be disappointed at a policy- and cost-driven decline in important demand

SYDNEY — In describing India as an “amazing opportunity,” U.S. Energy Secretary Rick Perry presumably is eyeing it as a long-term export destination for American coal that would be used to power plants built with American technology.

If this is the case, then the energy secretary is mistaken.

Granted, U.S. coal exports surged in 2017 mostly on demand from Asia. Thermal coal—used for power generation as opposed to metallurgical manufacturing purposes — accounted for most of that increase. India was the No. 1 destination.

And it’s also true that India will continue to import metallurgical coal for the foreseeable future due to a lack of sufficient suitable domestic reserves, even with the state-owned Coal India in 2017 announcing a target to halve metallurgical imports by 2030.

However, in the long -term, India will cease to be a thermal coal export destination for any country, the U.S. included.

While the International Energy Agency (IEA) in its most recent World Energy Outlook has India’s coal imports rising 72 million tonnes coal equivalent (Mtce) to 235Mtce by 2040, that forecast should qualified on a couple of points.

First, the IEA projects that three-quarters of the increase will be driven by metallurgical coal. Second, the agency has left itself plenty of wiggle room for change.

There’s also the fact that the IEA outlook, dated 2017, uses 2016 renewable energy installation data to assess the India’s renewables trajectory, noting that solar-PV capacity increased 80% to 9 GW in that calendar year alone.

The agency also concedes that a faster-than-expected drop in solar costs going forward would “result in significant upside potential for solar PV and downside for coal.”

SO THE IEA WILL VERY LIKELY HAVE TO DECREASE ITS THERMAL COAL IMPORT PROJECTION FOR INDIA its next annual outlook report based simply on the fact that 2017 was a landmark year for Indian renewables.

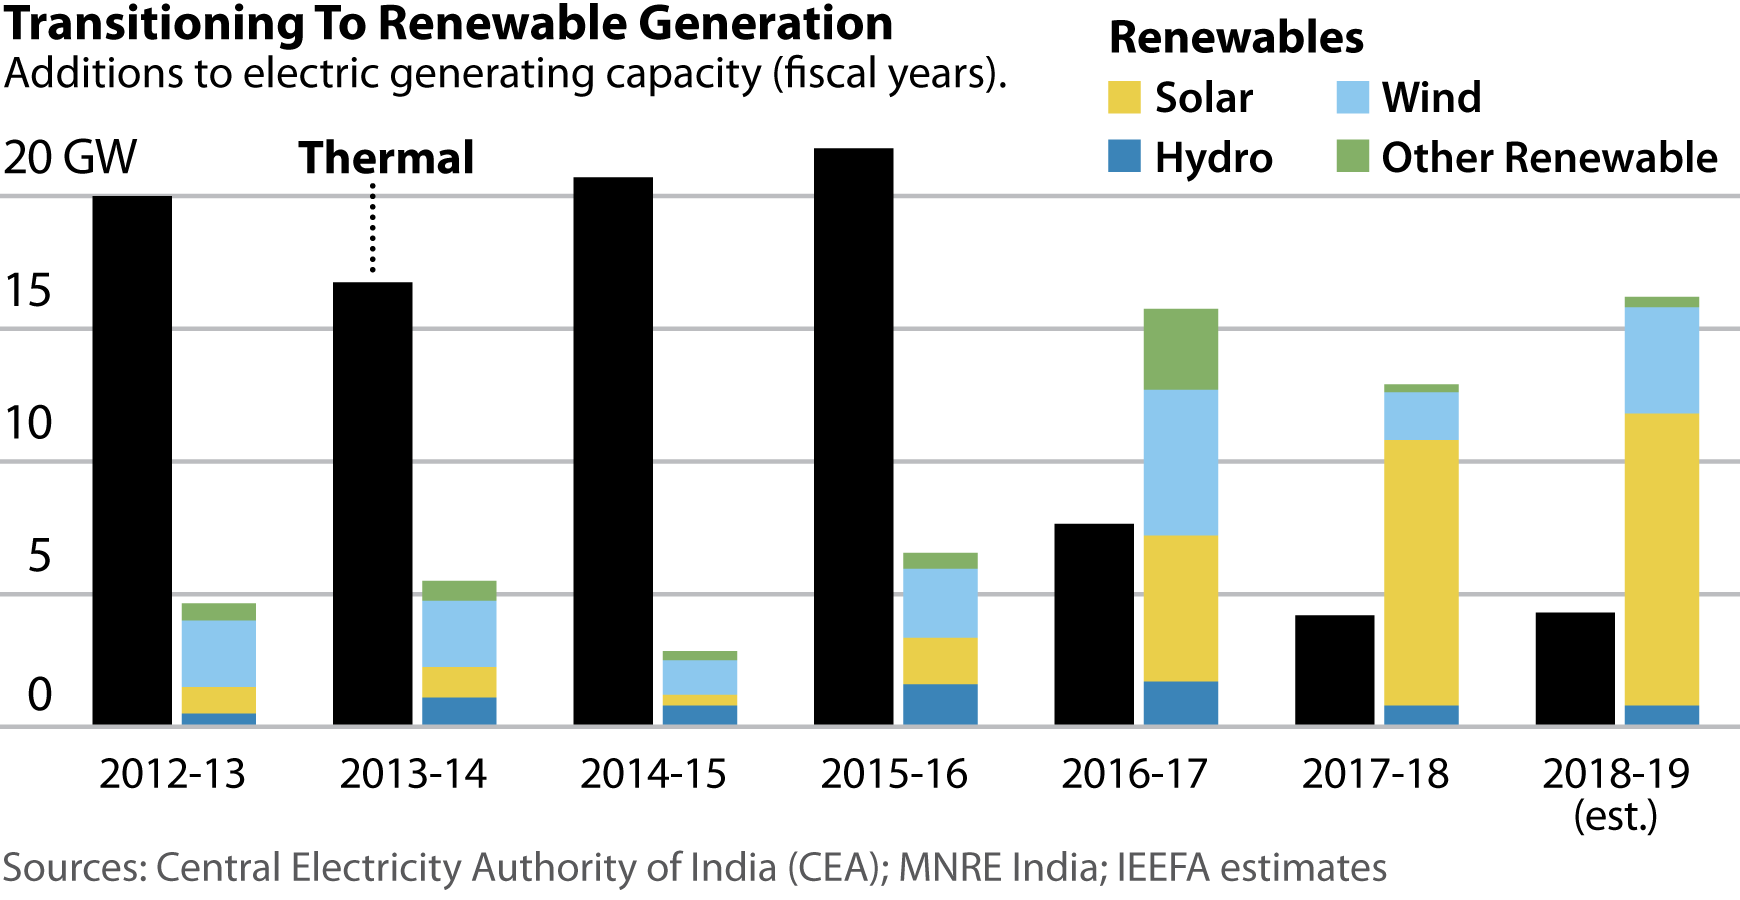
Last year saw such large reductions in the cost of Indian solar PV and wind power that such renewables are now cheaper than existing domestic coal-fired power. The Indian fiscal year that ended in March 2017 was the first one in which combined renewables installations outpaced coal-fired power construction (with net thermal installs falling 65% year on year to a decade-low 7.7 GW).

The following fiscal year, from April 2017 to March 2018, saw net thermal installs of just 4.2 GW (down an additional 46% year on year) and the addition of more solar PV capacity than all other technologies combined, with a total of 10.4 GW.

In this fiscal year, India has only expanded its renewables ambitions. Power Minister R. K. Singh announced recently the possibility of a 100 GW solar tender program. Although no details have been released as to how such a program would work, it is in line and with an announcement by Japan’s SoftBank that it intends to invest US$60-100 billion in Indian solar.

The India government has also recently announced a move into offshore wind, with a total installed-capacity target of 30 GW by 2030.

The IEA’s overly optimistic view of Indian coal imports is rooted partly in the agency’s assertion that, “For the moment, imports appear to be the cheapest supply option along most of India’s western coastline.”

Since that statement was published, things have turned increasingly sour for Indian west-coast power plants that run on imported coal.

The two largest coal-fired power plants in India, the Mundra power stations owned by Tata Power and Adani Power have proven to be economically unviable due to the doubling of imported coal prices since 2016. Tata Power has stated that it will aim to fuel 50% of its plant’s generation, designed for imported coal, with domestic coal in a move IEEFA estimates would reduce its fuel costs by over US$150m annually relative to current spot prices.

Analysts at Bank of America Merrill Lynch see Indian banks facing US$38 billion in losses on bad loans to the coal-fired power sector.

Meanwhile, Adani Power has turned off most of the units at its Mundra plant, as it is cheaper to incur a penalty for breach of power purchase agreement than lose money on every kilowatt hour generated. Adani Power Mundra may now seek bankruptcy protection, a development that hardly seems to support the IEA’s assertion that India’s west coast may become “a new arbitrage point and price marker for global trade.”

Further, the recently reported fate of a stranded coal-fired plant in Jharkhand state, home to India’s largest coal reserves, shows that it isn’t just plants reliant on imported coal that are in trouble. And last month’s cancellation by NPTC, the state-owned utility, of a 4GW coal plant proposed for Andhra Pradesh supports IEEFA’s view.

Analysts at Bank of America Merrill Lynch have said Indian banks face US$38 billion in losses on bad loans to the coal-fired power sector—a sector that contains the most significant loan risk in India.

With banks unwilling to take loss ratios of up to 75% on their power-sector lending, there is no relief in sight and—under these circumstances—it is not surprising that India’s planned coal power pipeline has shrunk by 547 GW since 2010 — hardly a promising indicator for U.S. coal technology opportunities in India.

Indian government actions that may help improve the financial health of the nation’s power distribution companies by driving increased efficiency of domestic coal production and delivery will only result in even less need for thermal coal imports. India’s electricity generation future, in other words, will be based on cheap renewables and domestic coal, with the Central Electricity Authority continuing to target a cessation of thermal coal imports.

The IEA in its outlook concedes that “A reversal in the projected trend of rising imports is possible if circumstances change” and says such a change “would have significant repercussions for coal exporters around the world.”

Given that India’s coal imports peaked in 2014/15 and have declined nearly every quarter since, IEEFA would contend that those circumstances have changed already.

Simon Nicholas is a Sydney-based IEEFA energy finance analyst.

The U.S. Energy Information Administration forecast coal production in 2019 to total 688 million st, down 2.7 percent from year-ago at manufacturing level, revealed Tuesday’s short-term energy outlook from the EIA.

London — US coal exports totaled 7.2 million mt in June, down 12.6% from May and down 21.6% from the year-ago month, according to US Census data Friday.

Exports dropped as global seaborne thermal coal prices hit three-month lows in June, with European-delivered CIF ARA prices averaging $48.36/mt, down 50% from the year-ago month.

Loading issues in New Orleans caused by high river levels and a decline in US coal railcar loadings also curbed exports for the month.

“The decline in railcar loadings has been driven in part by weak domestic demand, but has also cut some export supply as rail movements in the West and Midwest were curtailed due to flooding,” S&P Global Platts Analytics said.

Bituminous coal exports in June totaled 2.2 million mt, down 34.1% from the prior month and 39.1% from the year-ago month. Year-to-date bituminous coal exports totaled 17.1 million mt, down 14.9% from the same period last year.

Top bituminous coal destinations in June were India, at 607,651 mt compared with 704,596 mt in the prior month; the Netherlands, at 402,561 mt compared with 576,648 mt; and Egypt, at 378,172 mt compared with 334,355mt.

For the year to date, the top bituminous coal export destinations were India, at 4.96 million mt compared with 5.4 million mt in the year-ago period; the Netherlands, at 2.7 million mt compared with 2.1 million mt; and Japan with 1.9 million mt compared with 1.6 million mt.

Subbituminous coal exports totaled 301,660 mt, up 152.4% from the prior month but down 50.7% from the year-ago month. Year-to-date subbituminous coal exports totaled 2.2 million mt, down 37.1% from the same period last year.

Top subbituminous coal destinations in June were South Korea with 226,095 mt compared with 45,523 mt in the prior month, and Mexico at 75,565 mt compared with 14,669 mt.

For the year to date, the top subbituminous coal export destinations were South Korea, at 1.2 million mt compared with 2.7 million mt in the year-ago period; Mexico, at 717,728 mt compared with 1 million mt; and Egypt, at 174,816 compared with zero tons last year.

Metallurgical coal exports in June totaled 4.7 million mt, down 2% from the prior month and down 5.3% from the year-ago month. Year-to-date met coal exports totaled 26.3 million mt, down 8.8% from the same period last year.

Top met coal destinations in June were Japan at 673,803 mt compared with 644,102 mt in the prior month; Brazil at 656,265 mt compared with 560,019 mt and the Netherlands with 381,411 compared with 163,566.

For the year to date, top met coal export destinations were Brazil, at 3.5 million mt compared with 3.9 million mt in the year-ago period; Japan, at 3.3 million mt compared with 2.7 million mt; and the Netherlands, at 2.8 million mt compared with 2.5 million mt.

Source: spglobal.com
  • Slowing demand from China
  • Prices for benchmark premium Australian coal out of Newcastle hit their weakest since September 2016
  • Renewable are expanding – Hydro, Natural Gas


NUSA DUA, Indonesia (Reuters) – Slowing economic growth in China is weighing on demand expectations for thermal coal in the world’s biggest market for the fuel, while global moves towards cleaner energy are compounding problems arising from a glut in supply.

This supply-demand tandem is likely to keep prices for coal used in power plants and the manufacture of cement under pressure in coming months and perhaps longer, industry sources said as Asia’s biggest coal conference got underway.

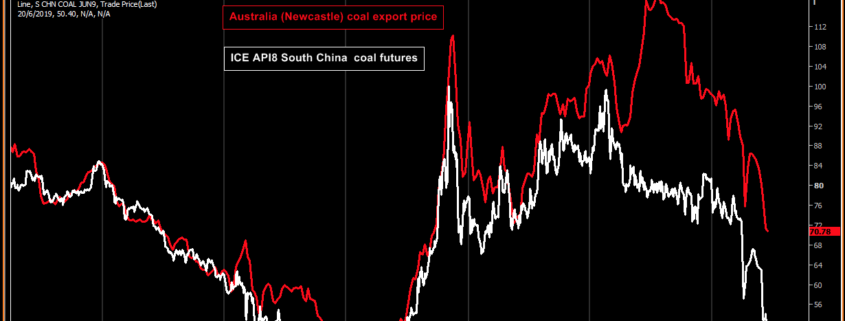
Prices for benchmark premium Australian coal out of Newcastle hit their weakest since September 2016 last week at $70.78 per tonne and are likely to fall further given a slowing global economy.

In top consumer China, factory activity weakened in April and May, hit hard by a bruising trade war with the United States. That accounts for some, but hardly all, of the 4.9% fall in China’s coal-fired power generation in May compared with the year before, said analyst Helen Lau at Argonaut in Hong Kong.

“Weak consumption of thermal coal is mainly because of increasing competition from hydro and other clean energy,” she said in a report.

Coal at China’s Qinhuang port has fallen as well, to $95.53 per tonne on June 10, according to price publisher McCloskey, a whisker from two year lows.

“Thermal coal is under huge pressure at this moment, even though demand should pick up during summer time,” said a coal trader based in Jingtang port. Jingtang is a major coal-receiving port in northern China.

“I cannot make money with current prices, so I am diverting my business and doing some niche products like pulverised coal now,” the trader said.

A major culprit is the expansion of the use of cheap natural gas in Europe, said an energy trader in Singapore.

“Cheap gas in the United States is moving into Europe and that is pushing coal from South Africa and Colombia across to Asia. Russia has also ramped up selling in the Pacific basin,” he said.

China’s wind-generated power grew 5.6 percent in the first five months of the year, hydroelectric power grew 12.8 percent, compared with 0.2 percent growth in LNG and coal combined, according to Commonwealth Bank of Australia (CBA).

A prolonged period of low thermal prices may signal that the global economy is decarbonising – that is, moving away from carbon-based fuels to renewables such as solar and wind power – at a faster rate than expected, said CBA analyst Vivek Dhar.

This may hurt Australia the most because developed countries, which can afford to pay more for the high-energy, less-polluting coal it produces, are decarbonising at the fastest rates, Dhar said.

Germany already sources 40% of its power from renewable energy and has set a target of 65% by 2030. Britain is set this year to use more electricity from zero-carbon sources than from fossil fuel plants for the first time.

Already, prices for Newcastle 6,000-kilocalorie coal, have slumped around 58 percent since September, compared with a more modest decline of 20 percent for 5,500-kilocalorie grades, which were last trading at $51 a tonne, according to commodities pricing agency S&P Global Platts.

“I think the Australians are going to feel it,” the Singapore energy trader said.

#Reuters

Orlando, Florida — Volatility in the global thermal coal market is the new constant as the Northern European delivered price becomes redundant and demand centers change, requiring US producers to begin to adapt their export strategies, Javelin Global Commodities CEO said Thursday.
“Exports are being affected by a supply push on one side and a demand pull on the other,” providing a strong opportunity to build the export profile of the US, Javelin’s Peter Bradley said at the Eastern Fuel Buyers Conference in Orlando, Florida.

More coal-powered generation growth is entering the global market as countries in Southeast Asia, the Middle East and West Africa build coal plants at a higher rate than Western countries are getting rid of them.

Bradley noted as examples Pakistan building a 15-MW, coal-fired power plant and receiving its first proper delivery, along with a new 6,000 MW coal plant being built along the Suez Canal.

US COMPETITION

Competing with the US will be Russian coal as the country’s exports begin to see the most growth in the global market, Bradley said.

Russian exports have grown 3%-5% each year over the past few years, and are expected to continue to grow at that rate, he noted, adding that the country has invested a lot into ports and rail, particularly in the east.

On the other hand, Indonesian coal exports will peak this year and then begin to go down as the country builds its coal fleet and uses its domestic production.

Within US basins, Central Appalachian coal will struggle the most in exports as it competes with the Russian exports into Europe and the Middle East.

Higher sulfur Illinois Basin and Northern Appalachian coal, on the other hand, will compete well in Europe and Asia, Bradley said.

NAPP coal, he noted, is becoming an Asian product as European demand dies.

Asian buyers, he said, are changing global demand dynamics as they tend to buy spot rather than term-contracts, unlike European buyers.

The coal market has become a “huge map of volatility,” and “it is here to stay,” Bradley said.

“The biggest problem going forward is not moving coal, but finding new homes for high sulfur coal,” he said.

NORTHERN EUROPEAN DELIVERED PRICE STRUGGLING

The global coal market is becoming much more focused on the Pacific region, but “unfortunately benchmark hedging is all about the Atlantic and Europe,” Bradley said, emphasizing the lack of liquidity in the European market.

“API2 is becoming less and less relevant for exports,” Bradley said. “The market needs a hedging profile today, but how do you make it?”

In prior years when the API2 dropped exports also dropped, but the correlation is weakening, Bradley said. When the API2 dropped about $40/mt, Northern Appalachian dropped only $5/mt-$10/mt.
IMO 2020

Producers, though, need “discipline,” he noted. There needs to be more consolidation in the industry, especially as demand pulls back. “Learn to crank back production at times,” he said, emphasizing the need to deal with far more uncertainty.

As the US market faces a changing dynamic, it will become a “two-tier system” as producers build mines purely for exports, Bradley said.

IMO 2020 will have a massive impact on ocean freight, Bradley noted, adding that the importance of freight costs cannot be underestimated.

“Everyone has to adapt,” he said, adding that there will be higher pricing starting in Q1 2020 and “ocean freight will be super volatile through Q4/Q1 of 2020-2021.”

It’s important for exporters to lock in long term freight and manage the volatility, and essential for exporters to have lower ocean freight pricing because coal is moving longer distances.

Source:PlattsCOal

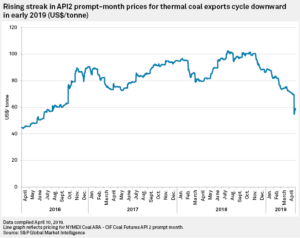
If API2 coal prices remain low for the next several months, there may be a ripple effect across the U.S. thermal coal space as the industry grows increasingly reliant on exports and domestic demand declines, analysts said. The API2 benchmark tracks the price of thermal coal sold into Europe.

Several U.S. coal producers benefited from strong international pricing in 2018, but many observers are predicting exports will decline this year as well as in 2020. Various factors may contribute to that decrease, including lessened demand in Europe, competition from Russia and political issues between nations, but analysts said lower prices will also make it less economically feasible for domestic producers to sell abroad.

API2 prompt-month prices for thermal coal have trended more positively overall since April 2016, even exceeding $100/t several times during 2018, according to data compiled by S&P Global Market Intelligence. Since late October 2018, API2 prompt-month prices have dropped considerably, falling below $70/t at the end of March and below $60/t during the first week of April.
Coal producers have locked in much of their 2019 sales already, but the current low pricing environment could start to affect pricing in the second half of 2019 and likely more significantly in 2020 if prices remain low through the summer or into the fall, several analysts said. U.S. thermal producers generally need prices anywhere from $70/t to $80/t to compete internationally.

Gregory Marmon, a senior research analyst at Wood Mackenzie, expects coal prices will remain below $80/t through the rest of 2019, causing exports to fall year over year from 2018 levels.

“They’re going up from today’s lows,” Marmon told Market Intelligence, “but they’re not going to hit the point where … the average coal mine in the U.S. is going to be profitable.”

Impact on domestic sector

With fewer tons being sold abroad, coal companies may shift that thermal coal back to the domestic market, which could put downward pressure on steam coal pricing, especially in the Illinois Basin and Northern Appalachia, Seaport Global Securities LLC analysts Mark Levin and Nathan Martin wrote in an April 8 report. That shift could even potentially hurt lower-grade metallurgical coal pricing.

Benjamin Nelson, Moody’s lead coal analyst, said the U.S. coal sector has grown increasingly dependent on exports. The sector has historically been a swing supplier in the global market because of its distance from international customers and costs, he said, but export volumes have increased significantly the last few years, even outrunning the declining domestic thermal demand more recently. That shift has helped “firm up prices domestically.”

“If there was a meaningful pullback in export volumes, that would create pressure on the domestic market,” Nelson told Market Intelligence, adding that, given the current pricing environment, “I think we’re getting to the point where we may start to feel that a little bit.”

But the industry does not always see an immediate impact of a short-term price movement, he said. If prices stay low or drop further, the industry will discuss those challenges throughout 2019.

“If you look forward to a coal industry that’s much more heavily reliant on exports, given where the U.S. producers are in terms of cost structure, that could cause the coal industry to become more volatile,” Nelson said. “But, again, there’s a lot of other forces that are at play here …. so it’s really hard to make definitive, long-term calls on something like volatility because exports are increasing.”

Clarksons Platou Securities analyst Jeremy Sussman said the larger exporters are “fairly insulated” from low pricing in the second half of the year, while smaller companies may be more affected. Low prices over the next three or four months will begin affecting early 2020 sales.

“We can live with Q2 being weak. It’s going to be harder to live with Q3 being weak,” Sussman told Market Intelligence, adding that, “if API2 pricing stays where it’s at, then domestic pricing is not going to be immune to the downturn.”

Levin and Martin estimated that thermal coal exports accounted for 38% of Foresight Energy LP 2018 shipments, 26% of Consol Energy Inc.’s and 25% of Alliance Resource Partners LP’s, making them the most exposed to export steam fluctuations. But the Powder River Basin, which some experts say is already oversupplied, may be hit the hardest if more tons are sold on the domestic thermal market, Sussman said. This situation could be worsened if export prices remain low and some of the larger Illinois Basin producers follow through on plans to increase production this year.

“While I would say the Illinois Basin would be the most directly negatively affected region from this, the reality is if you combine more domestic Illinois Basin coal with an already fragile PRB market, this doesn’t bode well for the PRB,” Sussman said.

But Marmon noted low utility stockpile levels, which may help make room for excess Illinois Basin coal being shifted to that market. The domestic market may help counterbalance some lost opportunities abroad.

Moody’s: Price drop will not have major effect on credit

From a credit perspective, some coal companies are generating “significant excess cash flow” and investing in share repurchases, Nelson said. Given their current financial situation and contracts, a modest drop in export volumes and compression in domestic prices “doesn’t create a big credit concern across the industry, broadly speaking.”

Companies may repurchase fewer shares if they see a decrease in cash flow from exports, he noted, but that would have more of an impact on the producers’ equity price rather than their credit quality.

“We don’t have many producers that are making significant investments in new capacity for exports,” Nelson said. “There’s been a couple projects discussed, but it’s not like we’re in the middle of a big capital wave and now we’re starting to see prices come off.”

Source: spglobal.com

Houston — Weekly US coal production totaled an estimated 13.78 million st in the week that ended February 16, up 5.6% from a week earlier but down 10% compared with the year-ago week, US Energy Information Administration data showed Thursday.

It was the third time in the first seven weeks of the year that all four basins saw week-on-week increases.

The total for Week 7 was 18.3% below the five-year average and was the lowest output in the last 20 years for the corresponding week.

Utility stockpiles remain low on an aggregate basis, totaling an estimated 89.89 million st as of February 14, down roughly 26.4% compared with a year earlier, according to S&P Global Platts Analytics.

In the latest week, estimated coal production in Wyoming and Montana, which is primarily made up of production from the Powder River Basin, totaled 6.09 million st, up 5.3% week on week, but down 12.6% compared with the year-ago week.

Since January 1, the states have produced 41.04 million st, down 6.9% from the same period in 2018. Annualized production in the two states would total 315.89 million st, down 7.1% from a year ago.

In Central Appalachia, estimated weekly coal production was 1.84 million st, up 4.8% from a week earlier but 6.5% lower than in the year-ago week.

Year-to-date production in Central Appalachia is up 1% year on year at 12.56 million st and is the only major basin ahead of where it was a year ago. On an annualized basis, CAPP production would total 96.43 million st, also up 1% year on year.

Weekly coal production in Northern Appalachia totaled 1.96 million st, up 6.8% from the prior week, but 5.8% lower than the year-ago week’s figure.

Year-to-date production in the basin is down 0.4% year on year at 13.09 million st, while annualized NAPP production would total 100.58 million st, down 2.1% from last year.

In the Illinois Basin, estimated weekly coal production was 1.99 million st, up 6.5% from last week but 9.1% lower than in the year-ago week. Cumulative production in 2019 is up to 13.4 million st, down 3.3% on year, while annualized production in the basin would total 102.9 million st, down 1.8% from the estimated 2018 total.

Through the first seven weeks of the year, US coal production totaled an estimated 92.96 million st, down 4% year on year, while production on an annualized basis is expected to be around 714.72 million st, which would be down 4.8% from last year.


Edited by: S&P Global

India’s thermal coal imports rose by more than 15 percent in the first three months of 2018, with Indonesia accounting for about three-fifths of total supplies, according to vessel arrival data from Dubai-based coal trader American Fuels & Natural Resources.

India’s rising coal imports are contributing to higher demand across Asia this year, which has pushed benchmark Australian coal cargo prices above $100/t, a price not seen at this time of year in more than half a decade.

Imports rose to 39.6-million tonnes during the three months ended March 31, the data from American Fuels, a supplier of coal from the United States, showed.

That is up from 34.4-million tonnes of thermal coal during the first three months of 2017, according to Indian government data which matched the data from American Fuels.

Government data for the first three months of 2018 has not been released yet.

The American Fuels figures are broadly in line with data from an Indian-based trading company reviewed by Reuters that showed imports were 37-million tonnes in the quarter.

India will likely increase 2018 thermal coal imports after two straight years of declines because of domestic logistics bottlenecks, regulatory changes and surging power demand.

Vasudev Pamnani, a senior trader at American Fuels, said India’s demand for coal with a higher calorific value, most of which has to be imported, was increasing since buyers want more energy from the coal they purchase to offset higher prices and the logistical problems, mainly railway delays.

South Africa was the second-largest source of foreign coal during the first quarter, supplying about one-quarter of the total imports, with the United States and Australia being the next largest sources, the data showed.

Adani Enterprises, India’s largest coal trader, accounted for about one-sixth of all the imports, purchasing about 6.51-million tonnes during the period, the data showed.

The Tata Group imported 5.23-million tonnes of coal during the period with Swiss Singapore, part of the Aditya Birla Group, taking in 2.92-million and JSW Group bringing in 2.48-million.

The companies did not respond to requests for comment.

The ports of Mundra, Krishnapatnam and Kandla handled about the two-fifths of all of the imports, according to American Fuels.

EDITED BY: Reuters