• Slowing demand from China
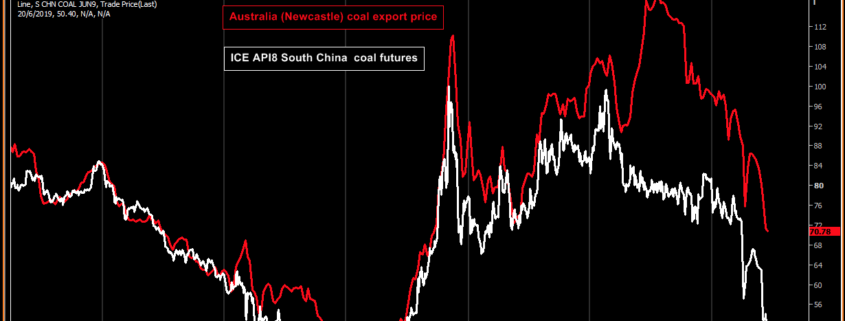
  • Prices for benchmark premium Australian coal out of Newcastle hit their weakest since September 2016
  • Renewable are expanding – Hydro, Natural Gas


NUSA DUA, Indonesia (Reuters) – Slowing economic growth in China is weighing on demand expectations for thermal coal in the world’s biggest market for the fuel, while global moves towards cleaner energy are compounding problems arising from a glut in supply.

This supply-demand tandem is likely to keep prices for coal used in power plants and the manufacture of cement under pressure in coming months and perhaps longer, industry sources said as Asia’s biggest coal conference got underway.

Prices for benchmark premium Australian coal out of Newcastle hit their weakest since September 2016 last week at $70.78 per tonne and are likely to fall further given a slowing global economy.

In top consumer China, factory activity weakened in April and May, hit hard by a bruising trade war with the United States. That accounts for some, but hardly all, of the 4.9% fall in China’s coal-fired power generation in May compared with the year before, said analyst Helen Lau at Argonaut in Hong Kong.

“Weak consumption of thermal coal is mainly because of increasing competition from hydro and other clean energy,” she said in a report.

Coal at China’s Qinhuang port has fallen as well, to $95.53 per tonne on June 10, according to price publisher McCloskey, a whisker from two year lows.

“Thermal coal is under huge pressure at this moment, even though demand should pick up during summer time,” said a coal trader based in Jingtang port. Jingtang is a major coal-receiving port in northern China.

“I cannot make money with current prices, so I am diverting my business and doing some niche products like pulverised coal now,” the trader said.

A major culprit is the expansion of the use of cheap natural gas in Europe, said an energy trader in Singapore.

“Cheap gas in the United States is moving into Europe and that is pushing coal from South Africa and Colombia across to Asia. Russia has also ramped up selling in the Pacific basin,” he said.

China’s wind-generated power grew 5.6 percent in the first five months of the year, hydroelectric power grew 12.8 percent, compared with 0.2 percent growth in LNG and coal combined, according to Commonwealth Bank of Australia (CBA).

A prolonged period of low thermal prices may signal that the global economy is decarbonising – that is, moving away from carbon-based fuels to renewables such as solar and wind power – at a faster rate than expected, said CBA analyst Vivek Dhar.

This may hurt Australia the most because developed countries, which can afford to pay more for the high-energy, less-polluting coal it produces, are decarbonising at the fastest rates, Dhar said.

Germany already sources 40% of its power from renewable energy and has set a target of 65% by 2030. Britain is set this year to use more electricity from zero-carbon sources than from fossil fuel plants for the first time.

Already, prices for Newcastle 6,000-kilocalorie coal, have slumped around 58 percent since September, compared with a more modest decline of 20 percent for 5,500-kilocalorie grades, which were last trading at $51 a tonne, according to commodities pricing agency S&P Global Platts.

“I think the Australians are going to feel it,” the Singapore energy trader said.

#Reuters

Orlando, Florida — Volatility in the global thermal coal market is the new constant as the Northern European delivered price becomes redundant and demand centers change, requiring US producers to begin to adapt their export strategies, Javelin Global Commodities CEO said Thursday.
“Exports are being affected by a supply push on one side and a demand pull on the other,” providing a strong opportunity to build the export profile of the US, Javelin’s Peter Bradley said at the Eastern Fuel Buyers Conference in Orlando, Florida.

More coal-powered generation growth is entering the global market as countries in Southeast Asia, the Middle East and West Africa build coal plants at a higher rate than Western countries are getting rid of them.

Bradley noted as examples Pakistan building a 15-MW, coal-fired power plant and receiving its first proper delivery, along with a new 6,000 MW coal plant being built along the Suez Canal.

US COMPETITION

Competing with the US will be Russian coal as the country’s exports begin to see the most growth in the global market, Bradley said.

Russian exports have grown 3%-5% each year over the past few years, and are expected to continue to grow at that rate, he noted, adding that the country has invested a lot into ports and rail, particularly in the east.

On the other hand, Indonesian coal exports will peak this year and then begin to go down as the country builds its coal fleet and uses its domestic production.

Within US basins, Central Appalachian coal will struggle the most in exports as it competes with the Russian exports into Europe and the Middle East.

Higher sulfur Illinois Basin and Northern Appalachian coal, on the other hand, will compete well in Europe and Asia, Bradley said.

NAPP coal, he noted, is becoming an Asian product as European demand dies.

Asian buyers, he said, are changing global demand dynamics as they tend to buy spot rather than term-contracts, unlike European buyers.

The coal market has become a “huge map of volatility,” and “it is here to stay,” Bradley said.

“The biggest problem going forward is not moving coal, but finding new homes for high sulfur coal,” he said.

NORTHERN EUROPEAN DELIVERED PRICE STRUGGLING

The global coal market is becoming much more focused on the Pacific region, but “unfortunately benchmark hedging is all about the Atlantic and Europe,” Bradley said, emphasizing the lack of liquidity in the European market.

“API2 is becoming less and less relevant for exports,” Bradley said. “The market needs a hedging profile today, but how do you make it?”

In prior years when the API2 dropped exports also dropped, but the correlation is weakening, Bradley said. When the API2 dropped about $40/mt, Northern Appalachian dropped only $5/mt-$10/mt.
IMO 2020

Producers, though, need “discipline,” he noted. There needs to be more consolidation in the industry, especially as demand pulls back. “Learn to crank back production at times,” he said, emphasizing the need to deal with far more uncertainty.

As the US market faces a changing dynamic, it will become a “two-tier system” as producers build mines purely for exports, Bradley said.

IMO 2020 will have a massive impact on ocean freight, Bradley noted, adding that the importance of freight costs cannot be underestimated.

“Everyone has to adapt,” he said, adding that there will be higher pricing starting in Q1 2020 and “ocean freight will be super volatile through Q4/Q1 of 2020-2021.”

It’s important for exporters to lock in long term freight and manage the volatility, and essential for exporters to have lower ocean freight pricing because coal is moving longer distances.

Source:PlattsCOal

Houston — Weekly US coal production totaled an estimated 13.78 million st in the week that ended February 16, up 5.6% from a week earlier but down 10% compared with the year-ago week, US Energy Information Administration data showed Thursday.

It was the third time in the first seven weeks of the year that all four basins saw week-on-week increases.

The total for Week 7 was 18.3% below the five-year average and was the lowest output in the last 20 years for the corresponding week.

Utility stockpiles remain low on an aggregate basis, totaling an estimated 89.89 million st as of February 14, down roughly 26.4% compared with a year earlier, according to S&P Global Platts Analytics.

In the latest week, estimated coal production in Wyoming and Montana, which is primarily made up of production from the Powder River Basin, totaled 6.09 million st, up 5.3% week on week, but down 12.6% compared with the year-ago week.

Since January 1, the states have produced 41.04 million st, down 6.9% from the same period in 2018. Annualized production in the two states would total 315.89 million st, down 7.1% from a year ago.

In Central Appalachia, estimated weekly coal production was 1.84 million st, up 4.8% from a week earlier but 6.5% lower than in the year-ago week.

Year-to-date production in Central Appalachia is up 1% year on year at 12.56 million st and is the only major basin ahead of where it was a year ago. On an annualized basis, CAPP production would total 96.43 million st, also up 1% year on year.

Weekly coal production in Northern Appalachia totaled 1.96 million st, up 6.8% from the prior week, but 5.8% lower than the year-ago week’s figure.

Year-to-date production in the basin is down 0.4% year on year at 13.09 million st, while annualized NAPP production would total 100.58 million st, down 2.1% from last year.

In the Illinois Basin, estimated weekly coal production was 1.99 million st, up 6.5% from last week but 9.1% lower than in the year-ago week. Cumulative production in 2019 is up to 13.4 million st, down 3.3% on year, while annualized production in the basin would total 102.9 million st, down 1.8% from the estimated 2018 total.

Through the first seven weeks of the year, US coal production totaled an estimated 92.96 million st, down 4% year on year, while production on an annualized basis is expected to be around 714.72 million st, which would be down 4.8% from last year.


Edited by: S&P Global

India’s thermal coal imports rose by more than 15 percent in the first three months of 2018, with Indonesia accounting for about three-fifths of total supplies, according to vessel arrival data from Dubai-based coal trader American Fuels & Natural Resources.

India’s rising coal imports are contributing to higher demand across Asia this year, which has pushed benchmark Australian coal cargo prices above $100/t, a price not seen at this time of year in more than half a decade.

Imports rose to 39.6-million tonnes during the three months ended March 31, the data from American Fuels, a supplier of coal from the United States, showed.

That is up from 34.4-million tonnes of thermal coal during the first three months of 2017, according to Indian government data which matched the data from American Fuels.

Government data for the first three months of 2018 has not been released yet.

The American Fuels figures are broadly in line with data from an Indian-based trading company reviewed by Reuters that showed imports were 37-million tonnes in the quarter.

India will likely increase 2018 thermal coal imports after two straight years of declines because of domestic logistics bottlenecks, regulatory changes and surging power demand.

Vasudev Pamnani, a senior trader at American Fuels, said India’s demand for coal with a higher calorific value, most of which has to be imported, was increasing since buyers want more energy from the coal they purchase to offset higher prices and the logistical problems, mainly railway delays.

South Africa was the second-largest source of foreign coal during the first quarter, supplying about one-quarter of the total imports, with the United States and Australia being the next largest sources, the data showed.

Adani Enterprises, India’s largest coal trader, accounted for about one-sixth of all the imports, purchasing about 6.51-million tonnes during the period, the data showed.

The Tata Group imported 5.23-million tonnes of coal during the period with Swiss Singapore, part of the Aditya Birla Group, taking in 2.92-million and JSW Group bringing in 2.48-million.

The companies did not respond to requests for comment.

The ports of Mundra, Krishnapatnam and Kandla handled about the two-fifths of all of the imports, according to American Fuels.

EDITED BY: Reuters

Houston (Platts)–29 Mar 2018 157 pm EDT/1757 GMT


Weekly US coal production totaled an estimated 15.46 million st in the week that ended March 24, up 1.6% from the prior week and up 7.2% from the year-ago week, US Energy Information Administration data showed Thursday.

The Appalachian and Powder River basins saw slight increases in production, although these rises were somewhat offset by decreases in other basins. It was the third highest production estimate so far in 2018.

S&P Global Platts Analytics estimates utility stockpiles in the week that ended March 22 totaled 111.27 million st, up 0.8% from the week prior but down 32.5% compared with the same point in 2017.

Based on EIA estimates through the first 12 weeks of the year, annualized US coal production in 2018 would total 770.7 million st, flat compared with last year.

In the most recently concluded reporting week, coal production in Wyoming and Montana, which primarily consists of coal from the Powder River Basin, totaled an estimated 7.1 million st, up 3.4% compared with last week and 8.9% compared with the year-ago week.

On an annualized basis, coal production in Wyoming and Montana would total 346.1 million st, down 2.1% from last year.

In Central Appalachia, weekly coal production totaled an estimated 1.9 million st, down 1.6% from last week, but up 14.8% from last year. Annualized 2018 production would total 96.9 million st, up 8.1% from last year.

In Northern Appalachia, weekly coal production totaled an estimated 2.1 million st, up 1.1% from last week and 4.5% from the year-ago week. Annualized production would total 104.7 million st, up 0.4% from last year.

In the Illinois Basin, weekly coal production totaled an estimated 2.1 million st, down 0.7% from last week but up 2.8% from last year. Annualized production would total 105.2 million st, up 1.7% from 2018.

–Veda Chowdhury, veda.chowdhury@spglobal.com

–Edited by Keiron Greenhalgh, keiron.greenhalgh@spglobal.com